What AI Can Reveal About Dementia/Alzheimer’s Disease Risk from Brain Imaging and Simple Tests
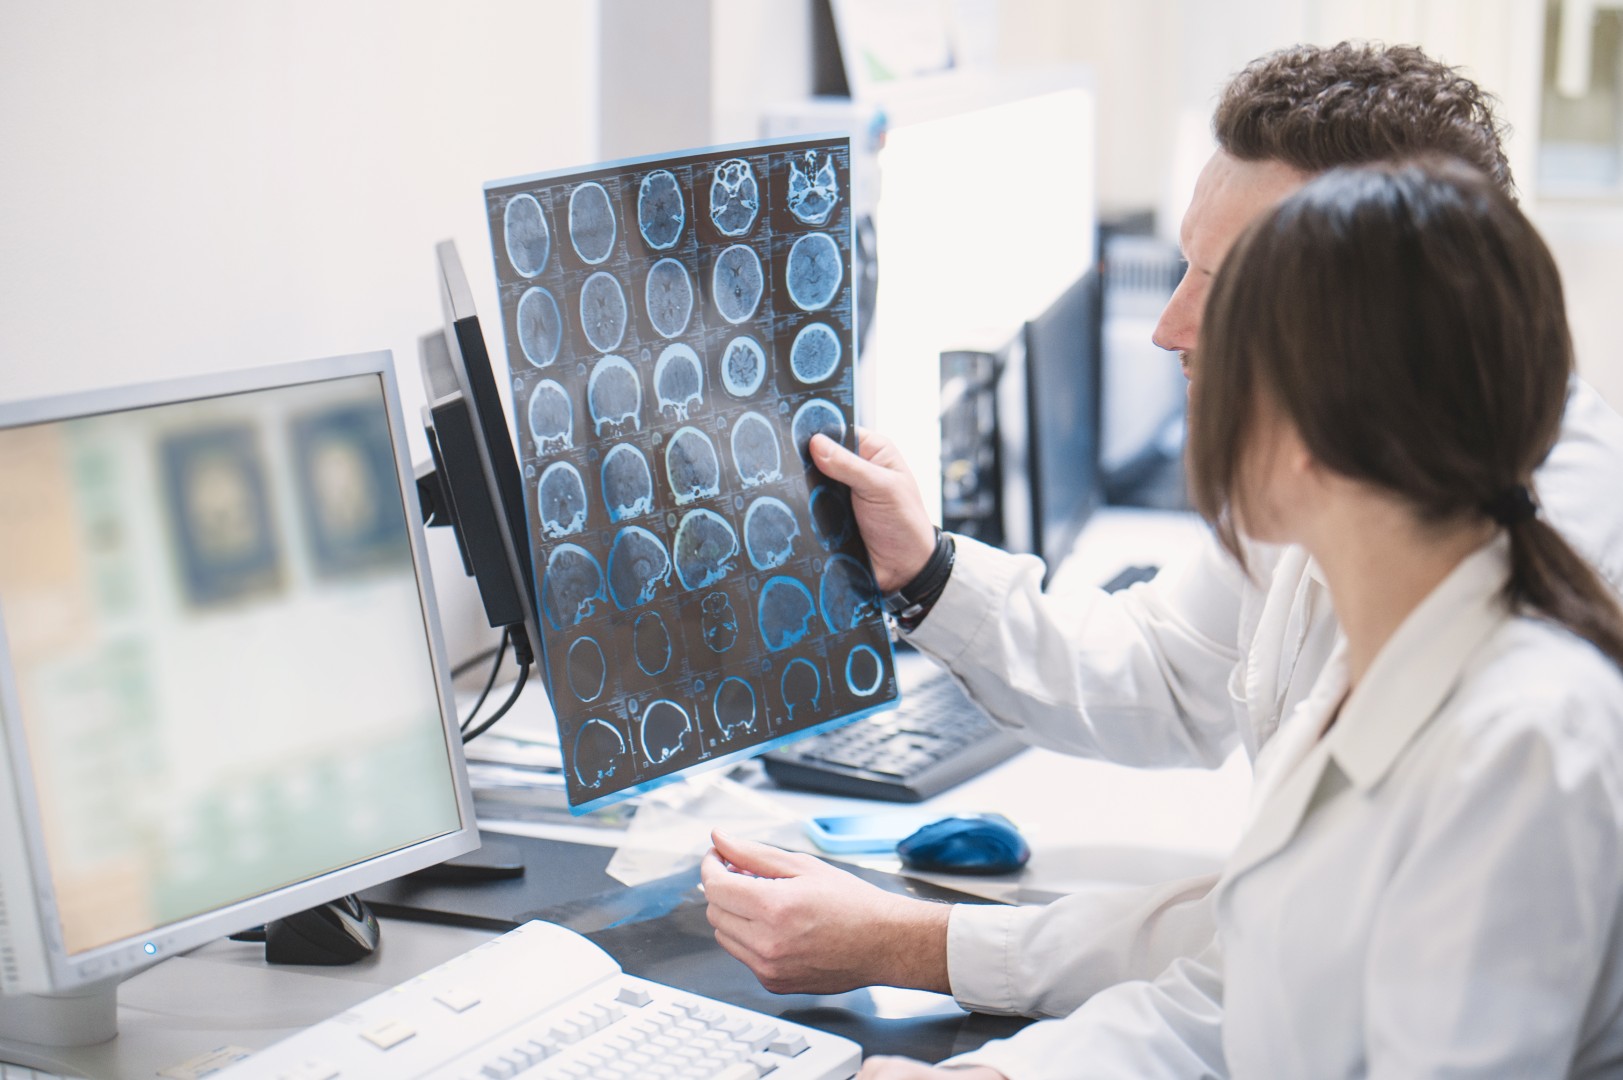
A quick cognitive screening test that takes only a few minutes, and brain-volume data automatically obtained from MRI scans: If these two pieces of information are brought together, how far can AI go in estimating dementia/Alzheimer’s disease risk from them? And if AI can make that prediction, can it also show us the reasons behind its assessment?
In this case study, we used the no-code AI platform Multi-Sigma® to explore this question using the public OASIS-2 dataset. The goal was not only to build a prediction model, but to go one step deeper: to use Contribution Analysis to examine what clues the AI relied on when making its prediction.
The clues used: simple tests and the brain’s “shape”
The AI was given five clues. The first was MMSE, a simple cognitive screening test. The next two were brain-volume indicators automatically calculated from MRI scans: nWBV (normalized Whole Brain Volume), which reflects the volume of the brain itself, and eTIV (estimated Total Intracranial Volume), which reflects the space inside the skull. To these, we added years of education and sex.
The analysis used data from 136 participants and 336 MRI scans, including 190 healthy cases and 146 dementia cases. Model performance was evaluated using subject-level cross-validation.
Through the AI’s eyes, the data looks different
Fig. 1 shows the “dementia classification value” assigned by the AI to each case, based on these clues. The values are shown separately for the actual healthy group in blue and the dementia group in orange. The two distributions are clearly separated: the healthy group gathers around lower values, while the dementia group shifts toward higher values.
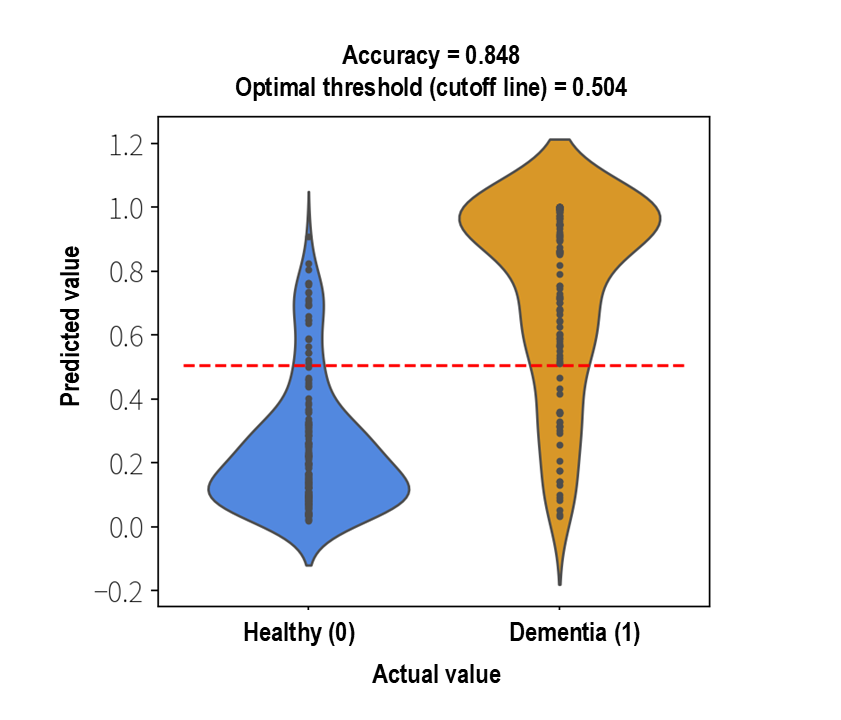
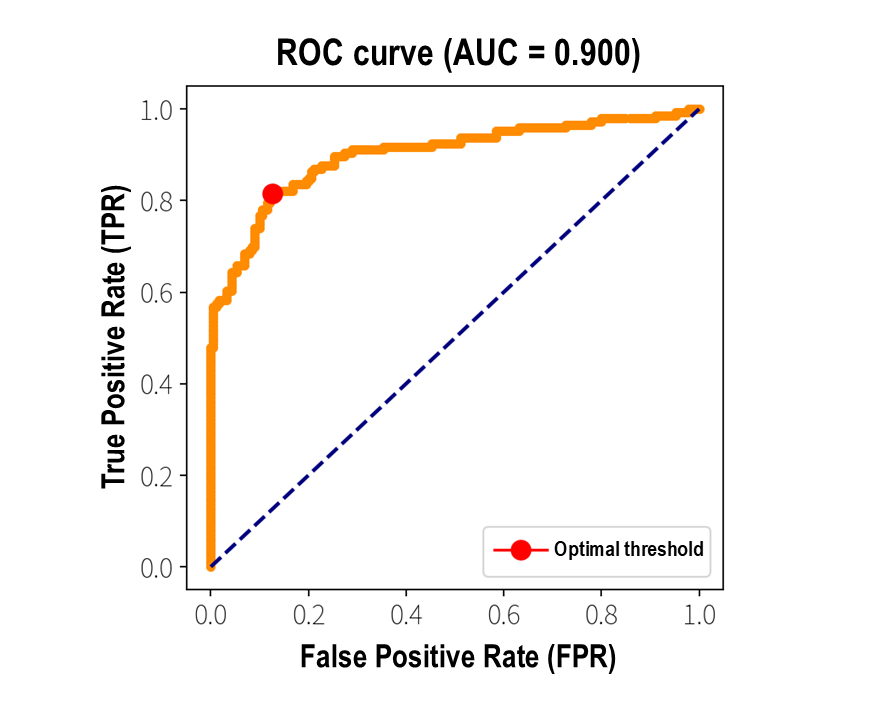
In this OASIS-2 dataset, the AUC (Area Under the ROC Curve), which shows how well the model distinguishes between the two groups, was approximately 0.90. At the optimal threshold, the accuracy was approximately 0.85 (with a sensitivity of 0.81 and a specificity of 0.87). The ROC curve in Fig. 2 also rises strongly toward the upper-left corner, clearly showing the model’s strong ability to distinguish between healthy and dementia cases.
Looking inside the prediction: what factors shape the AI’s judgment?
Many AI models simply return an answer such as “suspected dementia” or “no suspected dementia,” while the reasoning behind that judgment remains hidden inside a black box. Multi-Sigma®, however, makes it possible to see, in a clear and visual way, which factors pushed the predicted risk upward or downward, and by how much.
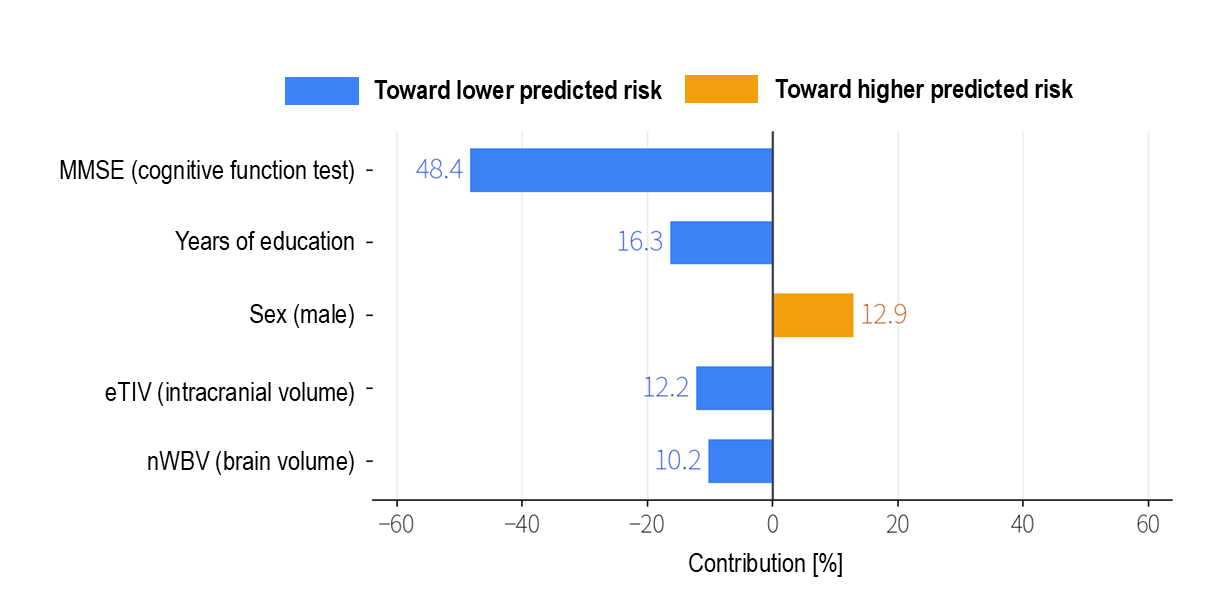
In Fig. 3, the bars extending to the right in orange show factors that contribute toward higher predicted risk, while the bars extending to the left in blue show factors that contribute toward lower predicted risk. The longer the bar, the stronger the influence of that factor on the AI’s prediction.
Cognitive function, brain structure, and learning
The strongest clue was MMSE, the cognitive screening test. It accounted for roughly half of the total contribution. Its direction was to the left: the higher the MMSE score, in other words, the better cognitive function was preserved, the lower the predicted risk became. This is exactly the kind of relationship we would naturally expect.
The next major clue was years of education, which also worked in the direction of lowering predicted risk. This result, that people with longer educational backgrounds tended to show lower risk, is consistent with the medical concept of Cognitive Reserve: the idea that years of intellectual activity may help strengthen the brain’s networks.
Brain volume, represented by nWBV, also contributed in the direction of lowering predicted risk. This captures a medically natural relationship: as brain atrophy progresses and nWBV decreases, predicted risk increases. On the other hand, eTIV (or estimated total intracranial volume) remains almost constant in adults and is not an indicator of brain atrophy itself. Here, it can be understood mainly as helping adjust for differences in body size (especially head size), thereby supporting the assessment of atrophy based on nWBV. As for sex, in this dataset, being male contributed in the direction of higher predicted risk.
Seeing what shapes the prediction without writing any code
What we want to emphasize here is that this entire flow, from building the prediction model to interpreting the factors behind it, can be carried out without writing a single line of code. With only on-screen operations, Multi-Sigma® builds the model and visualizes what pushes the predicted risk upward and what pulls it downward.
The analysis does not end with, “We built a highly accurate model.” It goes one step further, into the question that truly matters: why did the model reach that judgment? Researchers can explore that question for themselves. They can place very different types of information, such as cognitive test results and brain imaging indicators, on the same scale and compare them side by side.
This ability to see the reasons behind the prediction is perhaps the greatest value Multi-Sigma® brings to the research setting.
Beyond the prediction
By combining a simple cognitive screening test with objective brain-volume indicators, the AI was able to distinguish dementia status in the OASIS-2 dataset with an AUC of approximately 0.90 and an accuracy of approximately 0.85. But the greatest value of this analysis is not found in the numbers alone. The AI pointed to a clear and understandable pattern: cognitive decline and lower brain volume were linked to higher predicted risk, while years of education appeared to serve as a form of reserve. This kind of insight may offer useful clues when thinking about prevention and earlier awareness.
The goal is not simply to make a prediction and stop there. It is to understand the reasons behind that prediction. Multi-Sigma® makes it possible to see that next layer of the analysis, even without being a machine learning specialist.
Note: This article presents a research and data analysis case study using publicly available data. It is not intended to provide a medical diagnosis for any specific individual. Please consult a physician if you have any health concerns.
(Data source)
Data were provided by OASIS-2: Longitudinal: Principal Investigators: D. Marcus, R. Buckner, J. Csernansky, J. Morris; P50 AG05681, P01 AG03991, P01 AG026276, R01 AG021910, P20 MH071616, U24 RR021382.






機械学習を使った分析や予測が日常的に行われる今、協調フレームとしてのMulti-Sigma®の役割は増すばかりです。
『どのような場面で活用できるのか』をもっと知りたい方や、実際の利用シーンを見てみたい方は、是非一度お気軽にご相談ください。
In a world where machine learning-based analysis and prediction are becoming everyday practices, the role of Multi-Sigma® as a collaborative framework is more crucial than ever.
If you're interested in learning more about how it can be applied or want to see real-world examples, feel free to contact us.