Beyond the Solvent-Quality Trade-Off: How AI Chain Analysis Links Ink Formulation to Print Quality
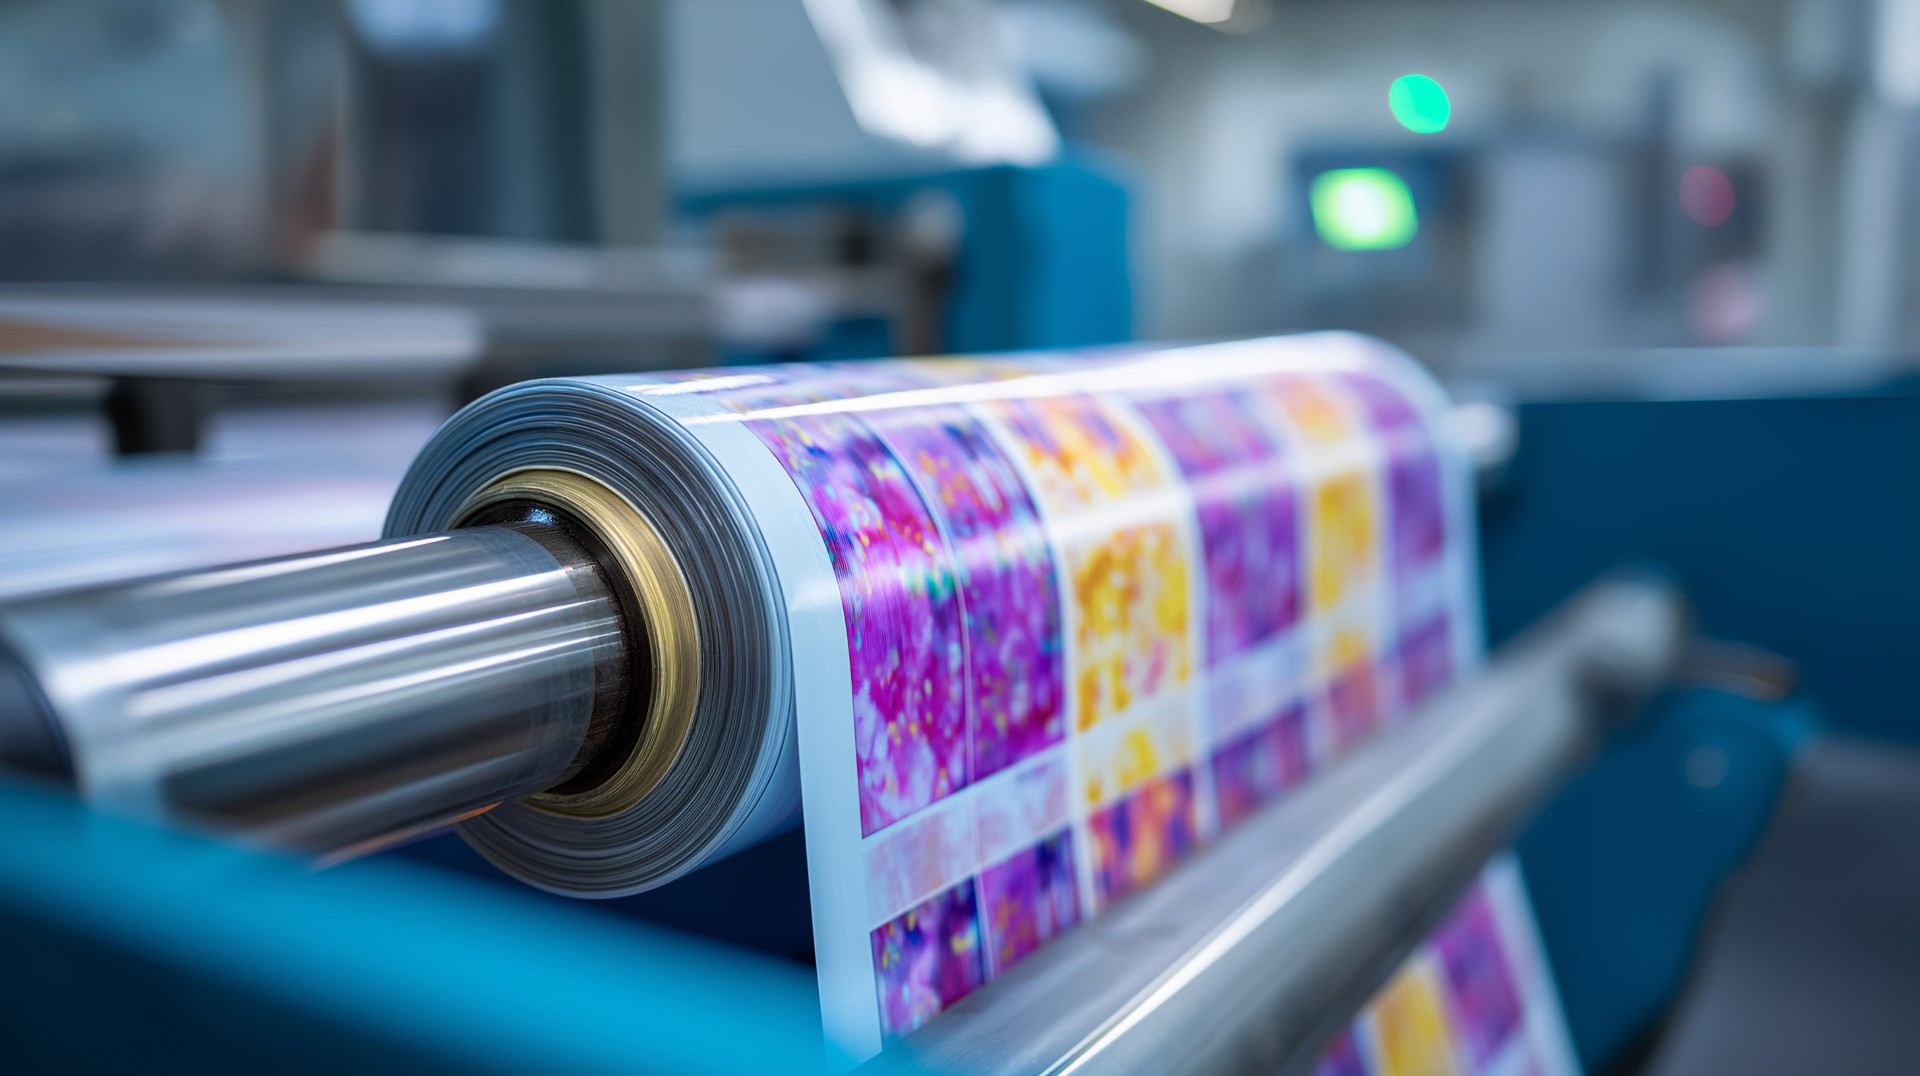
When you pick up a brightly printed bag of snacks at the supermarket, have you ever wondered how those vivid colors in the package were produced? For many years, printing on packaging films has relied mainly on inks dissolved in organic solvents similar to paint thinner. Once printing is complete, those solvents evaporate into the atmosphere. In other words, behind the attractiveness of that package lies a continuous release of volatile organic compounds (VOCs), a source of air pollution, together with CO2 emissions.
That landscape is now beginning to shift, and one of the forces behind it has little to do with the printing industry itself: the security of raw-material supply. In the first half of 2026, turmoil in the Middle East severely disrupted procurement of naphtha, a basic raw material (a mixture of hydrocarbons) for the petrochemical industry.
Prices, by early summer, had largely returned to the same levels as before the crisis started, yet the operating rate of Japan’s ethylene production facilities remained at just 66.5% in June, which is the lowest level ever recorded since statistics began in 1996. That matters because many of the solvents and other raw materials used in solvent-based inks are downstream petrochemical products whose supply chains ultimately depend on naphtha and the basic chemicals produced from it, including ethylene. At the same time, three major Japanese chemical companies have already agreed to consolidate their ethylene facilities in western Japan into a single site by fiscal 2030, pointing to a gradual contraction in domestic supply capacity itself. When a single geopolitical shock can shake supply chains while the spare capacity available in normal times is also shrinking, continued dependence on solvents starts to look more like a business risk.
One alternative already gaining ground elsewhere in the world is water-based flexographic printing, which uses water-based inks rather than conventional solvent-based inks. The process uses water-based ink and transfers it with a flexible printing plate that works rather like a large and soft “stamp”. When the shift to solvent-free processing extends through the lamination stage (bonding layers of material together) as well, estimates suggest that CO₂ emissions from package production can be reduced by roughly half compared with conventional solvent-based gravure printing.
Indeed, the contrast between markets is striking. Flexographic printing already accounts for around 60% of packaging printing in Europe and about 80% in the United States, while in Asia, including Japan, roughly 80% is still produced using conventional gravure methods. Yet that apparent gap tells another story too: Japan still has considerable room to make the transition.
What still holds water-based printing back? The quality barrier
“Switch to water-based ink and the colors lose their strength. Unevenness appears. The ink starts peeling away from the film”. These are familiar complaints on the production floor, and they stem from a basic difference in how water behaves. Because water has a higher surface tension than many organic solvents, it does not spread as readily across plastic films (simply put, it is more easily repelled by the surface). It also takes longer to dry. In other words, simply approaching water-based ink in the same way as a conventional solvent-based system does not work. Do that, and several aspects of print quality can deteriorate at once.
The real difficulty, however, is that there is no single problem to solve. It begins with the ink formulation (pigments, resins and additives) which determine properties such as viscosity and surface tension. Those properties then interact with the printing conditions (ink volume, printing speed, printing pressure, and drying temperature) and with the substrate itself. Only after all of these factors have played their part do we arrive at the qualities visible in the finished print (color density, uniformity, and adhesion). It is a chain in which every stage feeds into the next, while the variables continue to influence one another along the way. For years, the practical way through this complexity has been the experience of veteran operators, backed by repeated rounds of trial and error.
Even with all of this, there is yet another barrier: formulation data are held in the ink manufacturer’s labs, while printing-condition data are generated on the printing company’s production floor. The process is connected in reality, but the information describing it is fragmented across companies and across stages. As a result, a record showing that “this formulation, printed under these conditions, produced this level of quality” is, in most cases, simply not available.
A different way of thinking: Connecting process-specific AI through a common interface
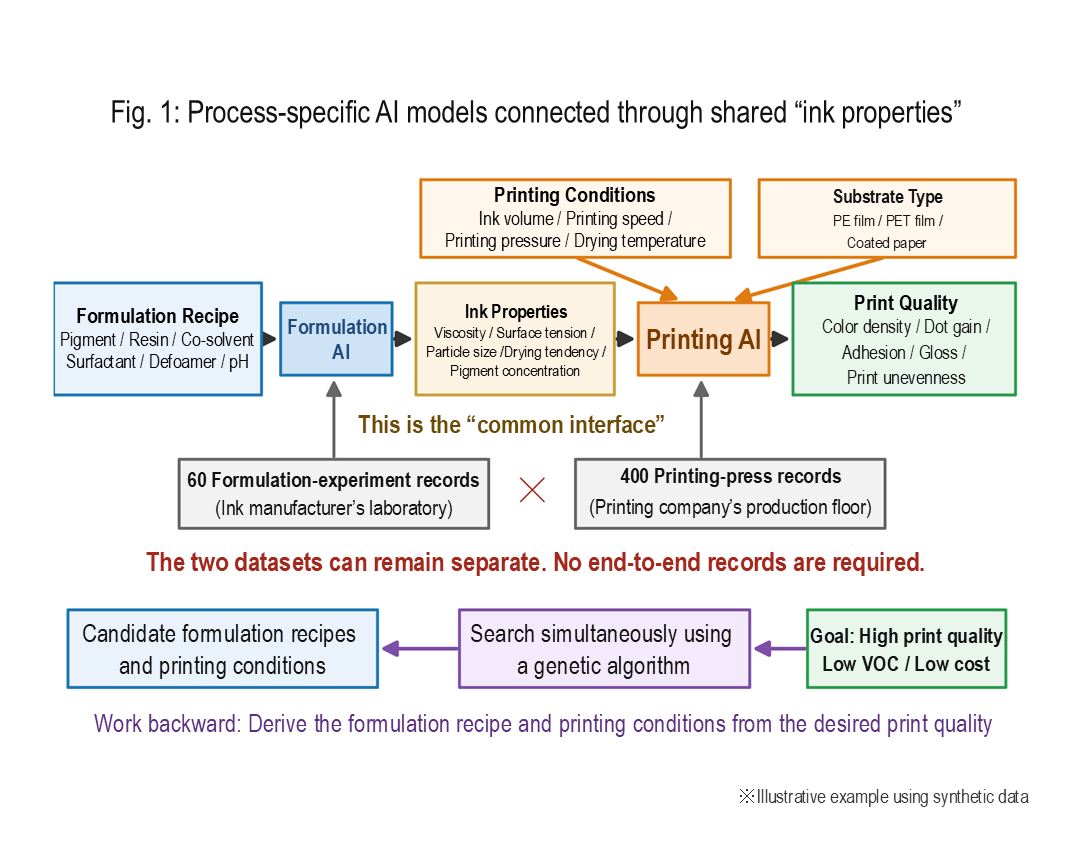
This is where Multi-Sigma®’s Chain Analysis comes into play. The idea is straightforward: instead of trying to build one AI model that understands the entire process from beginning to end, we give each stage its own specialist model, and then connect those models into a chain.
- Formulation AI: predicts ink properties from the formulation recipe
- Printing AI: predicts print quality from the ink properties, printing conditions and substrate type
The output of the Formulation AI is passed directly to the Printing AI. With that connection in place, a continuous path emerges from recipe to final print quality allowing us to visualize the outcome without actually having to run any printing tests.
The crucial point is what sits between the two models: the “ink properties” themselves become the common interface that allows the chain to work. This changes the data problem completely. The Formulation AI can be trained solely on laboratory data, while the Printing AI can learn independently from data generated on the printing press. There is no need to possess a single end-to-end dataset tracing every formulation all the way through to its final printed result. The data can remain separated by process, yet the models can still communicate across that divide. That is the central strength of Chain Analysis.
And once the models are connected, the chain can do more than predict what will happen. It can also help identify what is driving a result and even “work backward”, starting from the quality you want and tracing back toward the settings needed to achieve it.
Putting the workflow to the test: Recreating water-based flexographic ink development with synthetic data
Now it is time to see how the workflow works in practice. For this demonstration, we generated synthetic data on a computer using relationships designed to behave in a physically plausible way and then used those data to recreate the full development process (all numerical values are purely illustrative and do not represent results from any actual customer).
We also deliberately kept the two datasets separate: 60 laboratory formulation experiments for the Formulation AI and 400 printing-press records for the Printing AI.
Step 1: Let each of the two AIs learn from the data it handles best
Multi-Sigma® provides two different AI modeling approaches that can be used selectively:
- Gaussian Process Regression (GPR): which can be particularly effective when only a limited amount of data is available
- Neural networks: which can be useful for modeling larger datasets with complex nonlinear relationships
For this demonstration, we selected the modeling approach for each stage accordingly.
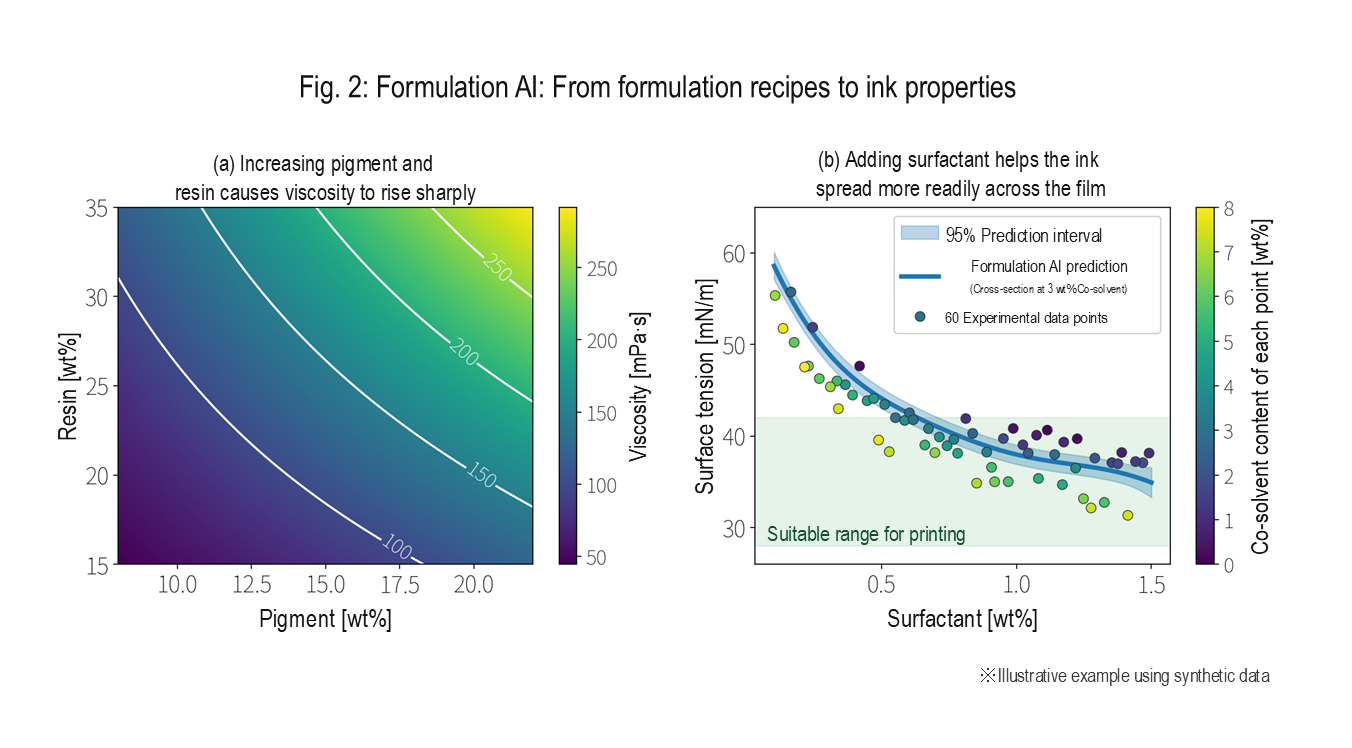
With only 60 data points available, the Formulation AI was built using GPR, which can learn effectively from relatively small datasets and offers another useful advantage. Rather than returning only a single prediction, it can also provide a range representing predictive uncertainties (Fig. 2).
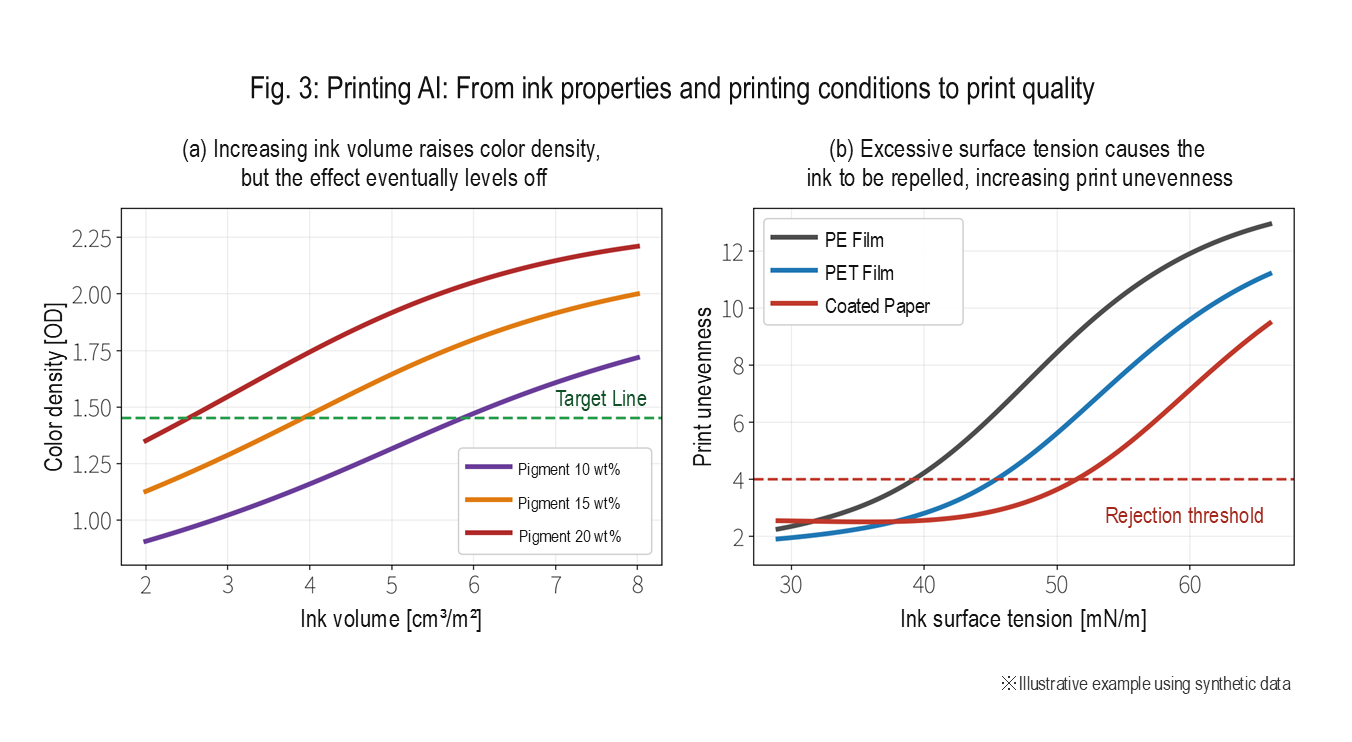
The Printing AI, by contrast, had 400 records to work with. Here, a neural network could make better use of the larger dataset and was trained to predict five print-quality characteristics at the same time (Fig. 3).
The logic is simple: use the model that best fits the data and the role it needs to perform. In this chain, each AI is given the part of the problem it is best equipped to handle.
It is also worth pausing for a moment to explain what we mean by the “overall print quality score”. For each of the five quality characteristics predicted by the Printing AI (color density, dot gain, adhesion, gloss, and print unevenness) we define a rejection threshold and a target value, then convert the result into an achievement score from 0 to 1 according to how closely it approaches the target. For color density (optical density), for example, 0.90 is the rejection threshold and 1.45 is the target. The conversion is smooth, with a score of 0.1 at the rejection threshold and 0.9 at the target. The five achievement scores are then combined with equal weighting using a geometric mean and converted into a 100-point print quality score. Because the individual values are multiplied together, a poor result in even one characteristic causes the overall score to fall substantially. This reflects the practical idea that a good product is only achieved when all aspects of quality are satisfactory. In actual development, different weights can also be assigned to the quality characteristics that matter most.
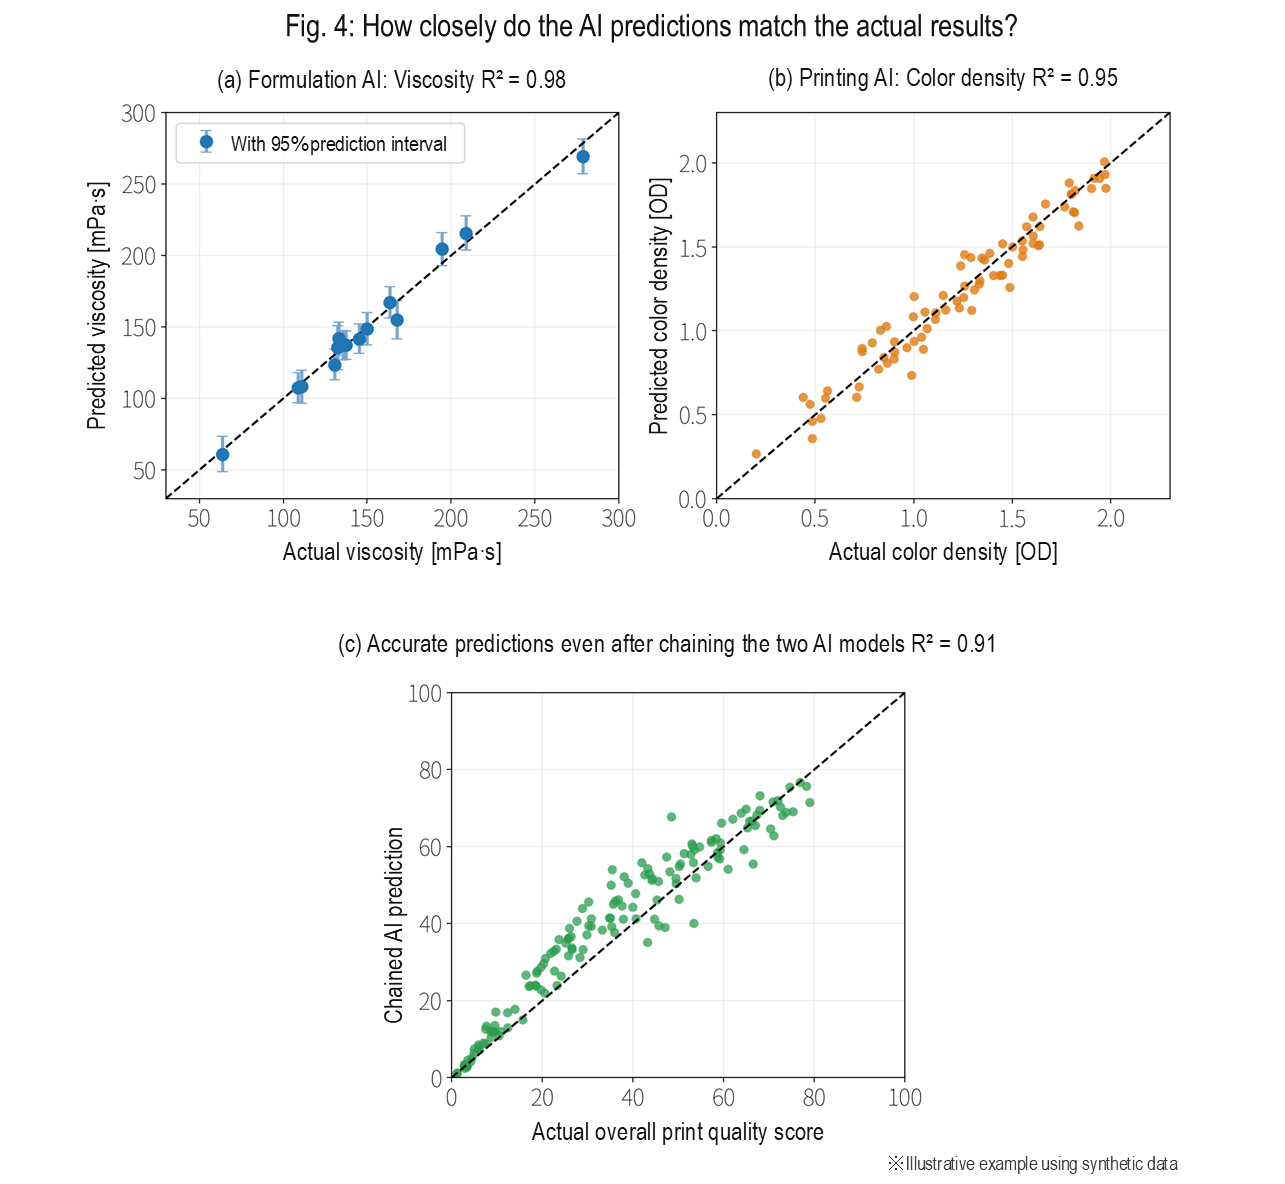
The obvious question, of course, is whether the predictions actually hold up. One way to judge this is with R² (a measure of how closely predicted values match the actual results, where 1.0 represents a perfect fit). By this measure, the Formulation AI achieved an R² of 0.93 or higher (Fig. 4, panel (a)), while the Printing AI ranged from 0.93 to 0.96 (Fig. 4, panel (b)). More importantly, even after the two models were connected into a single chain, the end-to-end prediction of overall print quality still achieved R² = 0.91 (Fig. 4, panel (c)). In other words, within this demonstration, the system retained sufficient accuracy to look ahead to the likely print outcome without having to run an actual print test.
Step 2: Which process is driving the defect?
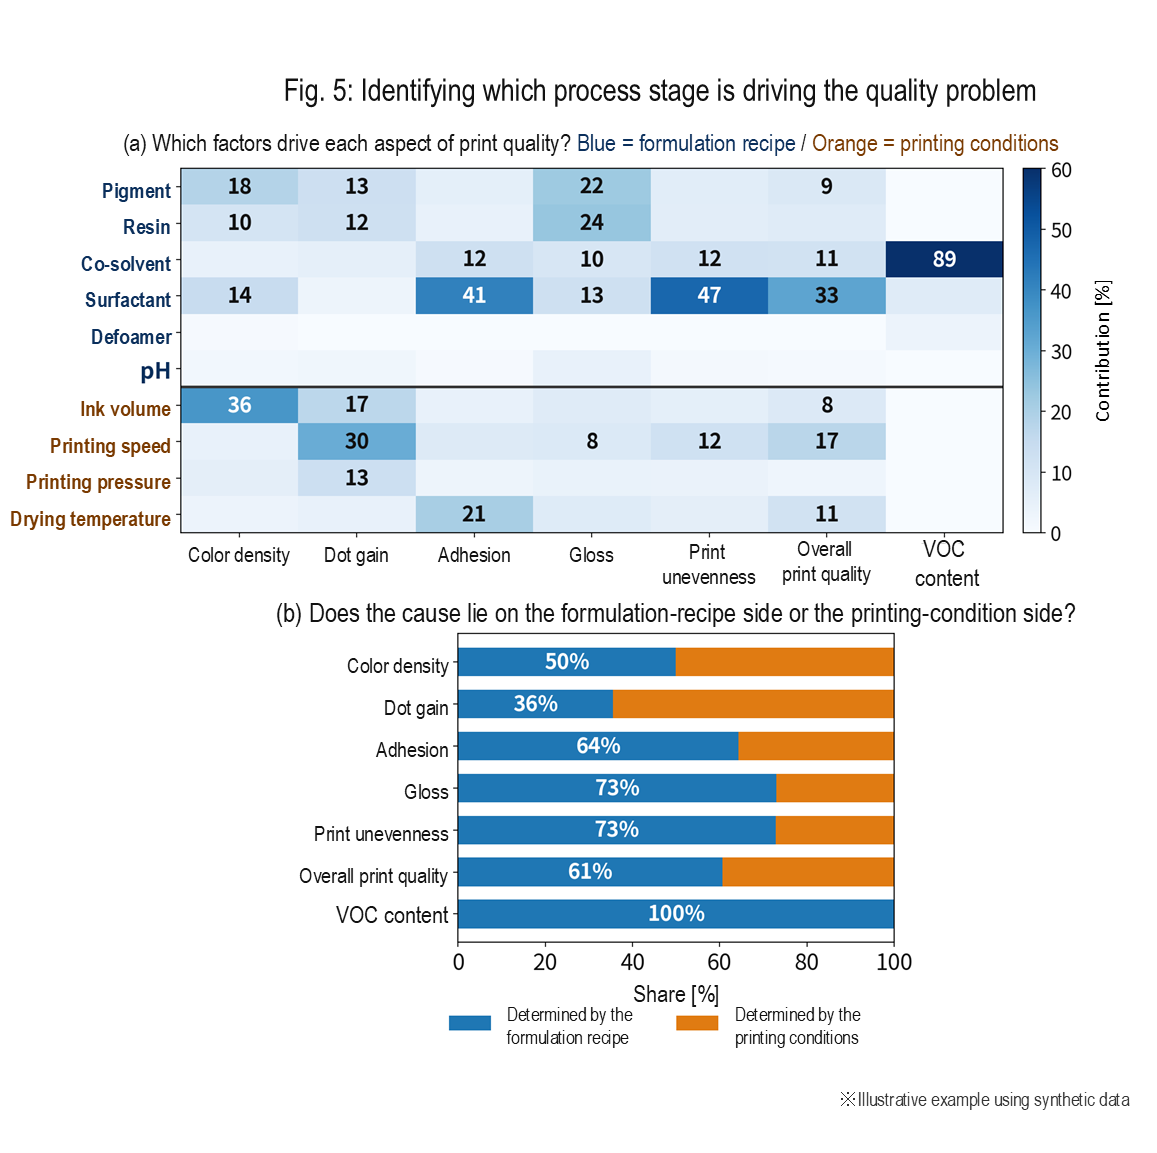
Chain Analysis has another important advantage. Because the ink properties linking the two AI models remain visible, it becomes possible to trace a quality problem back to its source and determine whether it originates on the formulation-recipe side or the printing-condition side (Fig. 5).
In this demonstration, the numbers pointed strongly toward the formulation recipe side for several important aspects of print quality: it accounted for 73% of gloss, 73% of print unevenness, and 64% of adhesion. For these characteristics, changing the printing conditions has limited effect. To achieve a real improvement, the formulation itself needs to be changed.
Dot gain, however, told a different story: 64% of its variation came from the printing conditions, with printing speed having the greatest influence. Color density was shaped jointly by ink volume and pigment content.
VOC content was simpler still: roughly 90% of the contribution to VOCs came from co-solvent content alone.
What might once have turned into a debate between departments over “which side is responsible?” can now be settled with numbers.
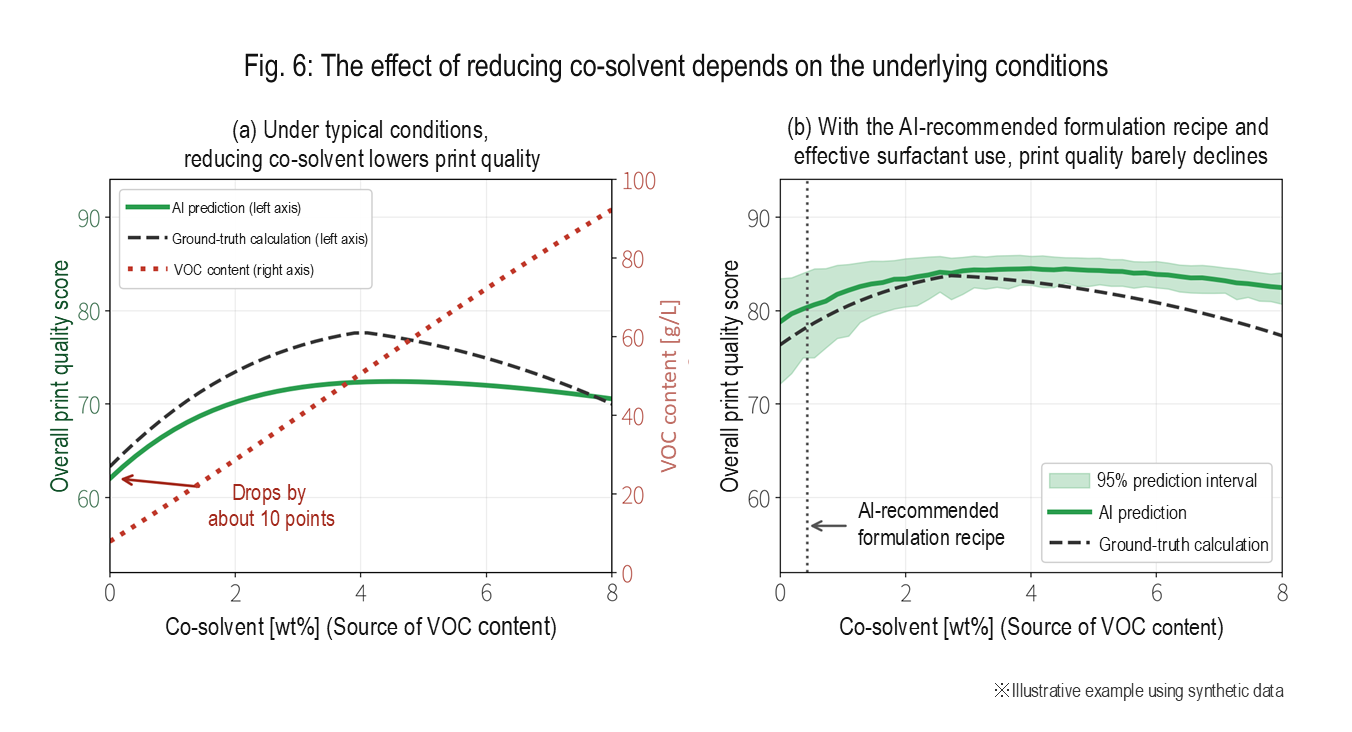
This is where the analysis reveals something particularly interesting. Look at the left side of Fig. 6. Here, the other formulation variables and the printing conditions are held at average values while only the co-solvent is reduced. VOCs fall exactly as intended, but overall print quality drops by around 10 points. It is a clear illustration of the trade-off familiar on the production floor: reducing solvent comes at the expense of quality.
What about the right side of the figure? The same reduction in co-solvent is applied to an AI-recommended formulation recipe, with the printing conditions also set to their recommended values. This time, even when the co-solvent is brought down to almost zero, print quality barely declines. The reason is straightforward: the co-solvent had been helping to lower surface tension, and the surfactant can take over much of that role.
Under average conditions, however, simply reducing the co-solvent causes quality to fall. A conventional one-factor-at-a-time (OFAT) approach can therefore easily lead us to give up on further solvent reduction at that point. In other words, there are combinations that are difficult to reach by the conventional approach of changing and testing one factor each time.
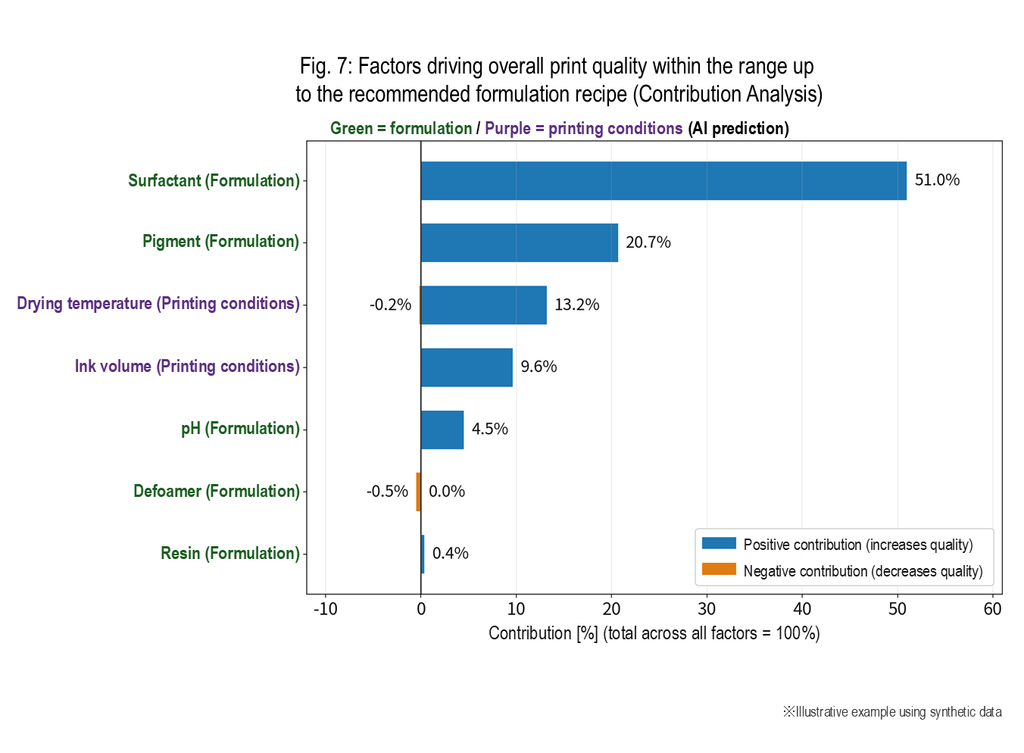
This leads to another question: which factors are responsible for the improvement in quality from the left side of Fig. 6 to the right? When variables interact with one another, simply replacing them one at a time may not provide a unique answer, because the result can depend on the order in which the substitutions are made.
To avoid that problem, we therefore applied the same logic used in Multi-Sigma®’s Contribution Analysis. The range of each variable was set from the conditions shown on the left side of Fig. 6 to the recommended formulation and printing conditions shown on the right. At many points within that range, each variable was moved slightly to determine how strongly, and in which direction, it affected print quality. The resulting contributions were then expressed as percentages that sum to 100% across all variables (Fig. 7).
The results suggest that more than half of the contribution to print quality came from the surfactant: approximately 50% in the AI prediction and 60% in the ground-truth calculation. Most of the remaining contribution came from pigment content and drying temperature.
Step 3: Working backward from the print quality you want
The final step turns the problem around. Instead of asking what quality a given formulation recipe will produce, we use the connected AI models to work backward from the outcome we want. A genetic algorithm, an optimization method inspired by biological evolution, was used to search simultaneously for three goals:
- high print quality
- low VOC content
- low cost
The search covered six formulation-recipe variables and three printing-condition variables at the same time, while printing speed and substrate type were fixed to reflect production constraints.
The results are shown in Fig. 8: rather than producing a single “best” answer, the search returned 120 candidate solutions, all positioned along the boundary where improving one objective would necessarily come at the expense of another. What the analysis provides, therefore, is not one prescribed recipe, but a map of viable choices allowing the user to decide where the best balance lies.
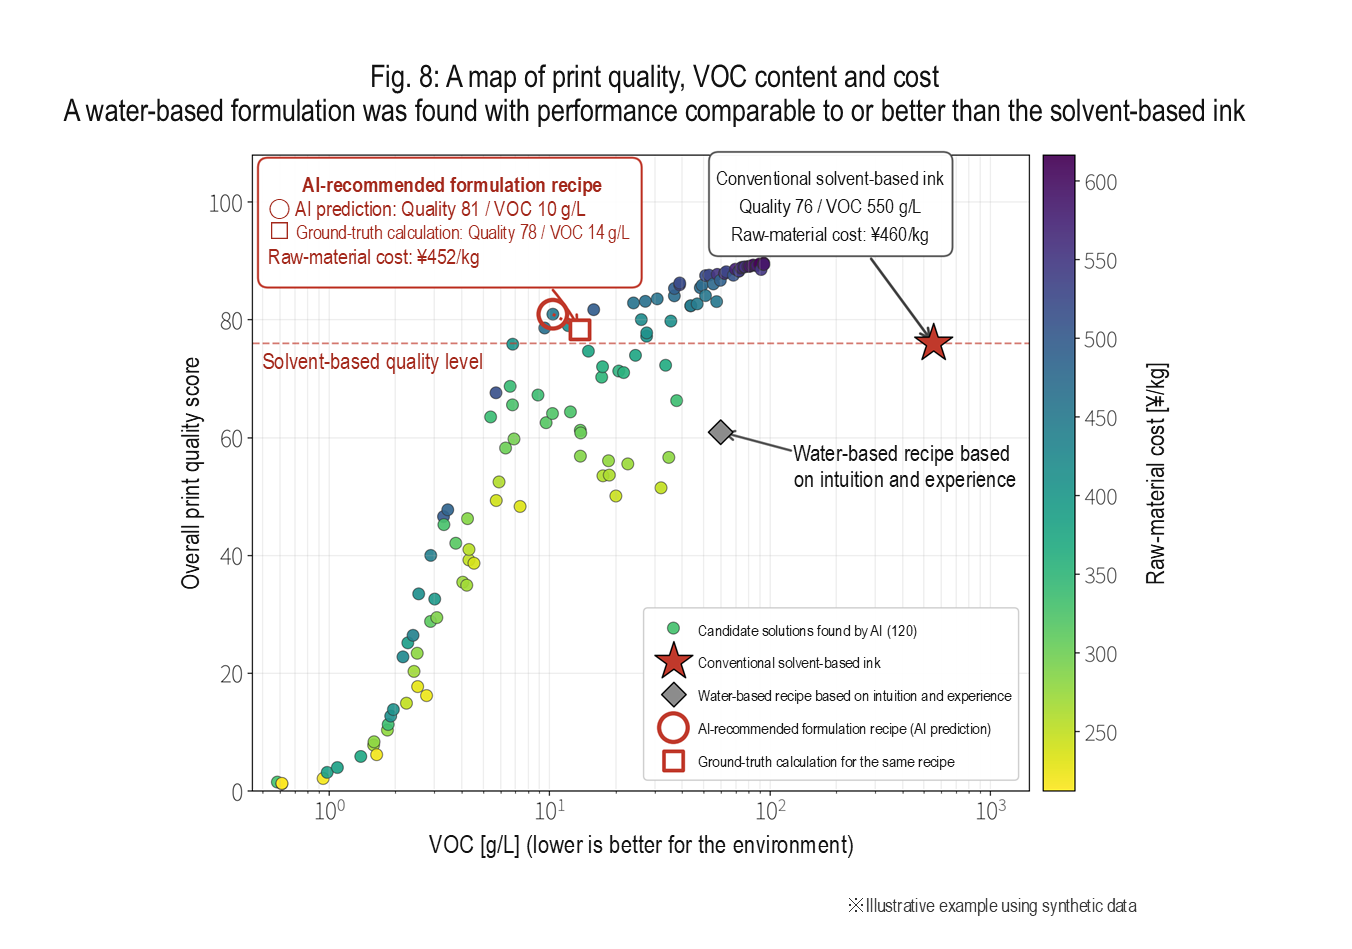
The standout result is the AI-recommended formulation recipe. Under the constraint that VOCs remain below 15 g/L, the formulation predicted by the AI to have the highest print quality (red circle) achieved a predicted quality score of 81 and VOC content of 10 g/L. When the same formulation was checked against the ground-truth calculation (red square), the corresponding values were a quality score of 78, VOC content of 14 g/L and a raw-material cost of ¥452/kg.
Now, compare that with the conventional solvent-based ink’s quality of 76, VOC content of 550 g/L and a cost of ¥460/kg. The difference is indeed striking!
The AI-recommended water-based formulation actually delivers comparable or better quality, cuts VOCs to roughly one-fortieth, and even comes in a little cheaper. It is also a major step forward from the initial water-based formulations developed through intuition and experience, for which AI predicted a quality score of 61 with VOC content of around 60 g/L.
So perhaps the supposed choice between “reducing solvent” and “preserving quality” was never an unavoidable trade-off after all. The problem was simply that we had not searched far enough. A formulation recipe capable of delivering both was there to be found.
An important caveat: When the models are chained, their errors travel too
There is, however, one point that deserves to be stated clearly. When AI models are connected into a chain, the errors produced by each model can propagate through that chain as well.
For this demonstration, we therefore checked the AI-generated answers against the “ground-truth calculation”. The recommended formulation recipe was predicted to score 81, while the actual calculated result was 78. Across the leading 59 candidates as a whole (with predicted scores of 70 or higher), the average deviation was just 1.8 points. In other words, the chained model retained accuracy that was sufficient for the purposes of this demonstration, but the error was not zero.
An even clearer illustration appears when the optimization is pushed to the extreme and VOC content is constrained to 5 g/L or less. The predicted quality score falls to 47.8, a dramatic drop from the recommended recipe’s predicted score of 81. In other words, once VOC is driven close enough to zero, the search reaches a cliff. More importantly, the AI’s prediction interval for this solution widened sharply, spanning 38 to 57 points. The model was effectively telling us: “There is not enough data in this region for me to be confident”. Acting on the point prediction alone would have been risky.
And the reason for this cliff lies in where the VOCs come from. The earlier finding that roughly 90% of the VOC content’s contribution comes from the co-solvent applies when the formulation is varied over a broad range. Even when the co-solvent is completely removed from the recommended recipe, however, the ground-truth calculation still leaves approximately 9 g/L of VOCs, of which 8.9 g/L comes from the surfactant. Reducing VOC content still further therefore requires reducing the surfactant itself, the same component that was helping to maintain print quality.
And for this particular extreme solution, the AI predicted VOC content of 3.5 g/L, while the ground-truth calculation gave 5.4 g/L. When the target itself is only 5 g/L, a difference of a few grams per liter is not negligible at all.
This is precisely why a point prediction alone could not be enough. When a predicted value lies close to an important threshold, we also need to understand how uncertain that prediction could be.
This is where an approach such as GPR becomes especially valuable for stages where data are scarce. In addition to a point prediction, it can provide us with a degree of confidence. Especially when the prediction interval begins to widen, that becomes a signal from the AI that “this is where more experimental data should be added”. The highest-ranked candidates should therefore be treated as promising leads, and with a small number of confirmation trials we can then close the loop. Even with that final step, the route is far shorter than repeatedly running experiments with little more than guesswork to guide the next move.
The same framework reaches far beyond printing
The structure we have followed here:
Formulation recipe → Changes in ink properties → Final print quality
is by no means unique to printing. Consider screen printing used in semiconductor and electronic-component manufacturing, for example. There, the formulation of a conductive paste determines the paste properties. Those properties then interact with the printing conditions to determine outcomes such as: line width, film thickness, electrical resistance, and yield.
The goal may be different, improving performance instead of reducing environmental impact, but the basic structure is the same. And that means the same Chain Analysis method can still be used.
Wherever a manufacturing process is built as a chain of interconnected stages, the same idea can become a powerful tool.
Conclusion: You can start even when the data are still fragmented
As this example shows, even when process data are fragmented across different stages, Chain Analysis can connect them through shared intermediate properties. The key points are as follows:
- By connecting process-specific AI models through shared intermediate properties, it becomes possible to model the path from a recipe to final quality even without a single end-to-end dataset.
- Because the intermediate properties remain visible, Chain Analysis can help determine which stage is responsible when a quality problem occurs.
- By running the chain backward, it becomes possible to search for candidate solutions that balance environmental impact, quality, and cost at the same time.
- However, errors can also propagate through the chain. The right approach is therefore to carry uncertainty forward along with the prediction, then confirm the most promising candidates with a small number of final trials.
What about your own production process? Are there experimental datasets or manufacturing logs sitting separately in different departments, never connected because no complete end-to-end record exists? Once linked, those isolated datasets may turn out to be far more valuable than they first appear.
With Multi-Sigma®, this kind of Chain Analysis can be carried out entirely through a no-code workflow. Upload the CSV files, connect the process stages with simple operations, and the analysis is ready to begin.
No programming or separate development environment is required. If you would like to explore what Chain Analysis could reveal about your own processes, please feel free to contact us, even if you do not have complete end-to-end records.
Note: All figures and numerical values presented in this article are illustrative examples generated from synthetic data based on physically plausible relationships. They do not represent measured values from any actual product or customer.
AIZOTH is actively involved in a wide range of collaborative research projects. If you are interested in pursuing an innovative study similar to the example introduced in this article we would be pleased to discuss the possibility of working together.
Interested in collaborative research? Please contact us from
here
AIZOTH also provides consulting services. If you are interested in applying Chain Analysis to your own process or would like support in carrying out this type of analysis, please feel free to contact us through the link below.
Have a question about our consulting services? Please contact us from
here.






機械学習を使った分析や予測が日常的に行われる今、協調フレームとしてのMulti-Sigma®の役割は増すばかりです。
『どのような場面で活用できるのか』をもっと知りたい方や、実際の利用シーンを見てみたい方は、是非一度お気軽にご相談ください。
In a world where machine learning-based analysis and prediction are becoming everyday practices, the role of Multi-Sigma® as a collaborative framework is more crucial than ever.
If you're interested in learning more about how it can be applied or want to see real-world examples, feel free to contact us.