This case study demonstrates how Multi-Sigma® was used to build a neural network model for time series data on retail sales, enabling one-week-ahead sales forecasting and contribution analysis for each department.
1. Data used for analysis
Although the public dataset includes department-level data across 45 stores, for simplicity, we focused our analysis on one store and selected departments within it. The dataset spans from 2010 to 2012; the last 20 weeks were used as the test set, while the preceding weeks were used for training the model. We then evaluated prediction accuracy and analyzed influential factors.
2. Future sales forecasting using Multi-Sigma®
When building a predictive model for time series data, using the raw data alone does not easily yield high prediction accuracy. Therefore, in this analysis, we performed extensive feature engineering. For example, to capture weekly seasonality, we applied sine/cosine transformations to the week information. Additionally, we assumed that discount campaigns from the previous week could affect sales in the current week, so we included various discount-related data from the previous week as additional features. We also added weekly sales data from the past four weeks and their aggregate values as supplementary features. Beyond these, we implemented numerous other detailed feature engineering techniques. Moreover, a proper training method is crucial in time series modeling to prevent data leakage. Multi-Sigma® makes it easy to implement such training methods, which we fully adopted in our analysis.

3. Sales contribution analysis using Multi-Sigma®
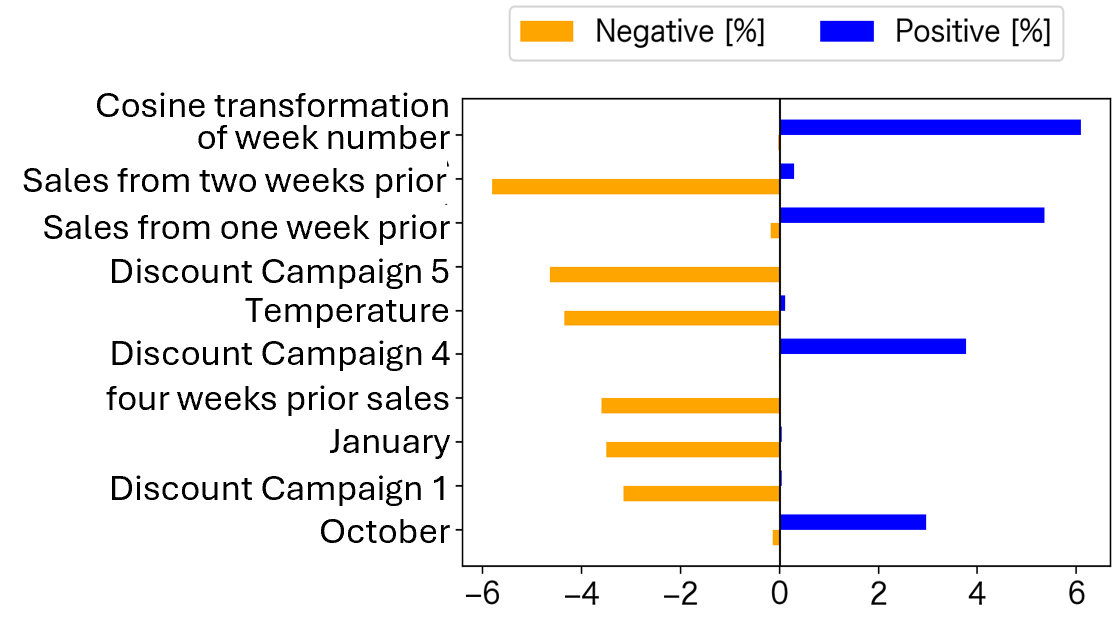
Using Multi-Sigma®’s contribution analysis feature, we identified the variables that have the greatest impact on sales forecasts for specific departments within the store. In this department, the number of weeks elapsed in the year—transformed using a cosine function—was found to have a positive influence on sales. Additionally, higher sales in the previous week and greater values for Discount Campaign 4 led to higher sales in the current week. It was also observed that sales tend to increase in October. Conversely, higher sales from two and four weeks prior led to a decrease in sales during the current week. Furthermore, the implementation of Discount Campaigns 1 and 5 was found to contribute to lower sales. It should be noted that the results of this contribution analysis vary depending on the store and department.

(Data) The data used in this analysis was processed and edited based on the data published in the article below, under Creative Commons Zero 1.0 Universal (CC0 1.0) license.
Data source: Retail Data Analytics(https://www.kaggle.com/datasets/manjeetsingh/retaildataset)
